Wages vs Productivity

classic Classic list List threaded Threaded
13 messages Options
Reply | Threaded
Open this post in threaded view
|

Wages vs Productivity

Harvey
Administrator
Can anyone help me understand, what happened in 1973?

"You just need to go at that shit wide open, hang on, and own it." —Camp
Reply | Threaded
Open this post in threaded view
|

Re: Wages vs Productivity

Brownski
Major League Baseball introduced the Designated Hitter. Nothing's been the same since.
"You want your skis? Go get 'em!" -W. Miller
Reply | Threaded
Open this post in threaded view
|

Re: Wages vs Productivity

MC2 5678F589
In reply to this post by Harvey
Let's throw some more data an to try to make sense of it:


Reply | Threaded
Open this post in threaded view
|

Re: Wages vs Productivity

JasonWx
In reply to this post by Harvey
1973 was the first gas shortage..followed by inflation
"Peace and Love"
Reply | Threaded
Open this post in threaded view
|

Re: Wages vs Productivity

warp daddy
This post was updated on .
First major energy crisis , partially in response by OPEC to the Yom Kippur war then followed by a period of hyper inflation , e.g. You could buy jumbo cds in the 11-13 percent range , followed later by stagflation ie wage curve dissipated yet interest rates remain high  . First major layoffs in my business ( higher education ) , unionism started at that point and wages were marginal at best if at all. In this time wages wereesentially frozen for a couple ofyears ...., happened twice during the seventies .  

The era of more with less had become entrenched , followed by the digital rev which led to increased productivity but more unfilled vacancies as a result . Short term ( perhaps a decade ) productivity showed tremendous gains as repetitive tasks were automated but ultimately like any enhancement that top Tops out.
 Downsizing rampant leading to dumb sizing ( those with options left and brain drain starts in many complex organizations ).

Editorial note : Made for some decent consulting however ..but the churn created was often debilitating on corporate survivors
Life ain't a dress rehearsal: Spread enthusiasm , avoid negative nuts.
Reply | Threaded
Open this post in threaded view
|

Re: Wages vs Productivity

Harvey
Administrator
When I see a chart that looks like that it has to be a structural change. An event (like the energy crisis or whatever) could cause a waver in the charts, but this is change in correlation between two big variables.

Gas is probably the same price or cheaper than it was before the energy crisis. It's not a structural change. Inflation is relatively low now too.
"You just need to go at that shit wide open, hang on, and own it." —Camp
Reply | Threaded
Open this post in threaded view
|

Re: Wages vs Productivity

tjf1967
In reply to this post by warp daddy
MIAMI DOLPHINS PERFECT SEASON!!

Reply | Threaded
Open this post in threaded view
|

Re: Wages vs Productivity

D.B. Cooper
It seems to me that it's got to do with post-WWII where baby boomers are entering the workforce en masse - many with degrees - and women are finding and keeping employment outside the house.  By this time the space race has ended and the chill of the cold war is well in force.

There's a Venn diagram in there somewhere.
Sent from the driver's seat of my car while in motion.
Reply | Threaded
Open this post in threaded view
|

Re: Wages vs Productivity

Milo Maltbie
The answer is all of the above, and more.

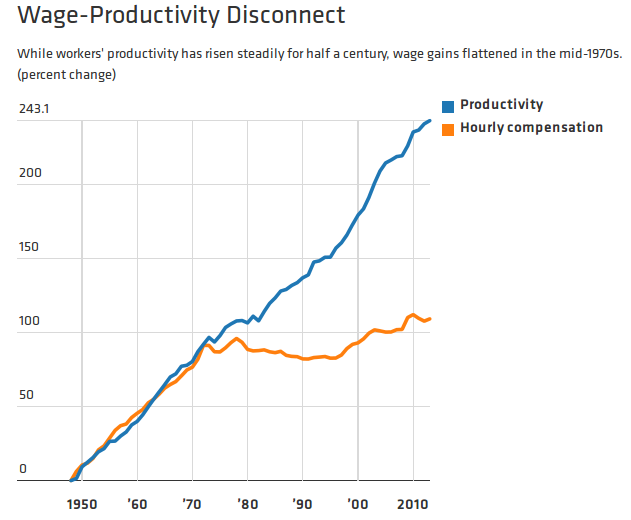
(To be fair, that chart might look a little better for wage workers if non-cash compensation, like health insurance, were included.  OTOH it might look worse if employer pension contributions were in it.)

What really happened was that the economy couldn’t expand fast enough to absorb baby boomers in the 70’s, which led to wage stagnation.  The liberal policies that were in place since the 1930’s were inadequate to solve that.  The new conservative (or neo-liberal) consensus that emerged was free markets in everything: free trade, deregulated financial markets, low taxes on business investment and laws undermining labor unions.

From a worldwide perspective, free trade has been a spectacular success.  Billions of people around the world, especially in Asia, have escaped poverty.  But for low/moderate skilled Americans, it meant they had to compete with Asian labor, which continues to suppress wage growth.  No union could have prevented that.  Technology has only exacerbated the problem because it allows more and more labor to be outsourced more efficiently.  Financial deregulation led to periodic instability caused by exotic derivative instruments that no one really understands.

So to summarize, if you are a wage worker, you are competing with Vietnamese workers, your union can’t help you, and your retirement depends on financial markets you can’t understand.

mm  
"Everywhere I turn, here I am." Susan Tedeschi
Z
Reply | Threaded
Open this post in threaded view
|

Re: Wages vs Productivity

Z
In reply to this post by Harvey
Surprised nobody has caught that Harv chart is full of BS

This claims that the avg wage in 2010 is a little roughly 120% more than 1950.  That is A ridiculous statement and not even close to accurate.

Just to give a base line the min wage in 1950 was 75 cents and in 2010 it was 10 times higher.

https://www.dol.gov/whd/minwage/chart.htm

What really most likely  happened  in that chart is that the wages were factored after inflation but we don’t know that becuase the axis are not properly labeled.   Proving if you are good with charts and graphs you can bend any set of data to prove any point you want.  

High Inflation during 1973 thru the early 90’s suppressed the after inflation wage gains.  And what happened in the 90s on is productivity exploded due to computer technology.  That gap can be seen if you chart corporate profits as the difference between wages and productivity closely matches profits.  

Matt’s graphs are exactly the socialist drivel I expect from him and his lack of economic understanding.
if You French Fry when you should Pizza you are going to have a bad time
Reply | Threaded
Open this post in threaded view
|

Re: Wages vs Productivity

Harvey
Administrator
This post was updated on .
It's not my chart.

I saw it in print and googled it and found this.   It seems a similar representation is coming from multiple sources.

Regardless of what caused it, something changed in 1973.  When I see two variables that respond like that (highly correlated to a specific point and then completely uncorrelated) I assume there is either a change in the way things are measured, or there was some structural change that could not be missed, like a world war or something else dramatic.

None of the explanations so far account for the dramatic and permanent nature of the change.
"You just need to go at that shit wide open, hang on, and own it." —Camp
Reply | Threaded
Open this post in threaded view
|

Re: Wages vs Productivity

MC2 5678F589
In reply to this post by Z
Z wrote
.  
Matt’s graphs are exactly the socialist drivel I expect from him and his lack of economic understanding.
How are graphs showing tax rates, union membership and share of income going to the 1% considered "socialist drivel"?

They're facts.

That'd be like me saying Dwight Gooden had 268 Strikeouts in 1985 and you telling me I was a communist who had no understanding of baseball.
Reply | Threaded
Open this post in threaded view
|

Re: Wages vs Productivity

MC2 5678F589
In reply to this post by Harvey