The Lake Effect Thread
1234
... 9
1234
... 9
|
Administrator
|
I know it's really early. But I know I'll need it eventually. And I'm already responsible for major thread drift on the Bobcat thread. So ...
I went to Google Maps to check out the Catskills. The map I was looking for would be of all of central NY to see the relationship between the Catskills ski resorts and the lake. When you step back Platte isn't really that much closer to the lake than Belle. But Plattes on the western edge of the elevation and that makes a big difference. Instead of the state wide map, I'm posting a map that adds less to the discussion, but looks way cool... 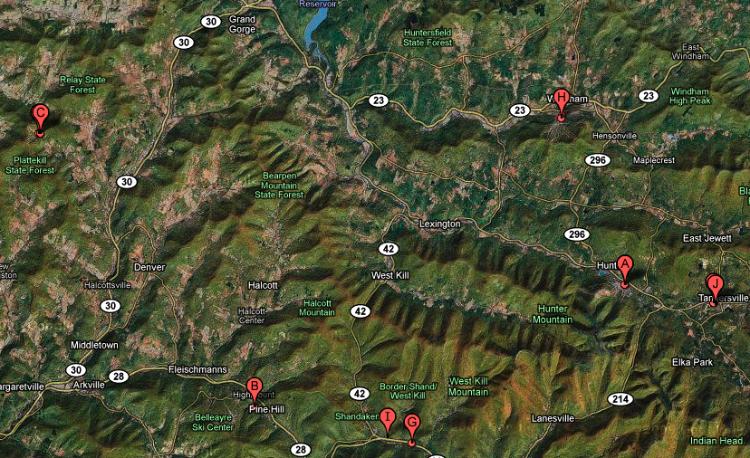 Here's the state. The letter "B" is Hunta: 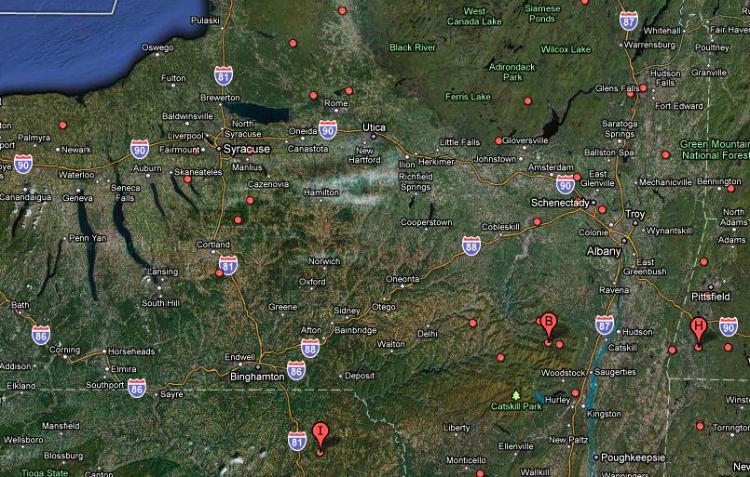 Now to Lake Effect: I've got a few interesting screencaps that I will dig up. When I see great lake effect events, I try to snag them. Here's one. Lake effect reaching the ocean. To me it's notable how improbable lake effect is in North Creek. 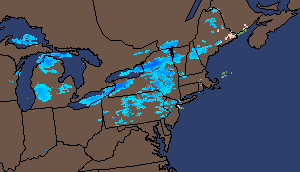 I will keep my LE stuff here, post about lake effect events, and hope to lure Skimore into posting video. Feel free to pile it on.
"You just need to go at that shit wide open, hang on, and own it." —Camp
|
|
For most LES events, especially when you get away from the immediate vicinity of the lakes, it's really much more about orographics than it is about location. For example, you routinely see the Berkshires and Southern Greens light up during an event with westerly flow, but there's nothing going on in the Hudson Valley to their west, despite the fact that the Valley is closer to the source of the moisture. A similar phenomenon is at work in both the Cats and the Dacks. We've both seen that annual snowfall graphic depicting a bullseye in the SW Dacks from LES. If one could find a map with sufficient accuracy and resolution, I'm sure it would show the same phenomenon, except with the bullseye being on the NW side of the Cats. I'm sure it's no coincidence that the claimed annual snowfall of the Catskill resorts falls off pretty clearly and dramatically the further East you are. Much of the available moisture is being wring out by the 3000' wall of the Plattekill ridge (I don't know what it's official name is). Similarly, I've read stories of how Bearpen Mtn, situated close to the far NW corner of the Cats, is reputed to receive a lot more snow than Hunter, at least anecdotally.
|
|
Administrator
|
This post was updated on .
True dat. Last season I remember a night when Kmart was in exactly the right spot. A narrow but intense plume of LE was coming off Ontario - almost exactly due East. That band was disorganized east of Indian Lake, non-existent in the Hudson Valley and it dumped 10 inches on Killington. Gore, very close to the proper trajectory, got a dusting. No one else got anything.
I'm dying to get my hands on the kind of precise map TW is imagining. This is the only map of NY State long term average snowfall I've been able to dig up on the web, and it's just not good enough. Here's a map that shows another rare trick that can drop some LE at Gore. The old Lake Erie upper cut. This one put snow down at Whiteface and Gore as I recall: 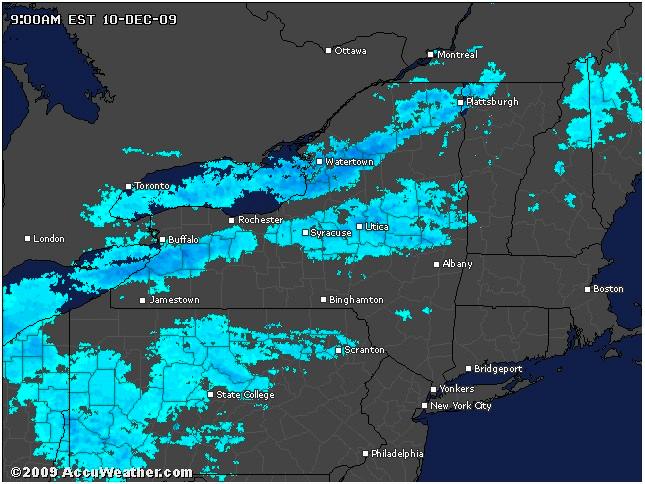
"You just need to go at that shit wide open, hang on, and own it." —Camp
|
|
"Lake Erie Upper Cut" - I love it!
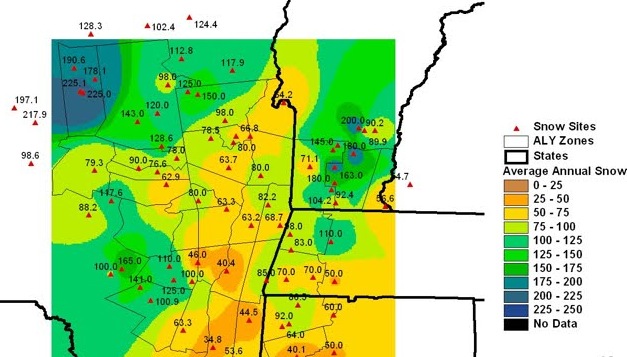
Clearly the map you linked to (that's the one I was referring to) doesn't have sufficient resolution or accuracy to answer this question. There is but one lone data point at or above 100" (looks like somewhere close to Fleischmans) and we know that's not accurate for the mountainous areas. Maybe relevant in the valleys but that's not helpful for this discussion. Do you have any screen caps illustrating the NW flow into the Cats? |
|
Administrator
|
This post was updated on .
Yea that map is vexing. If you know how to account for elevation it gives you something, but not much.
This snowfall map is a little better but only shows the KALY area: 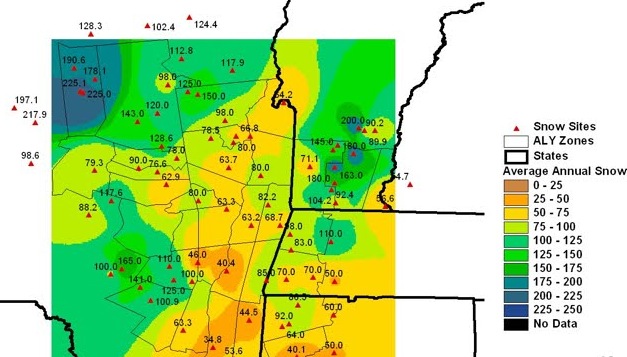 I wasn't really a Catskill watcher until I started running with James and Jason this past season. So I don't really have the screen caps we seek. (I guarantee they'll be added this season.) The knowledge I really need for the Cats is knowledge I have for the Daks. Finding each ski hill is on a state map that only shows county lines? Also known as a radar map. Here's a map. This cap was taken on 12/1 of 2009. It's the first snowfall I saw on radar after the big meltdown on Black Friday. Another rare occurrence of LE at Gore.  It wasn't a significant event as evidenced by pics from open day at Gore. (EDITED to add helpful snowfall map.)
"You just need to go at that shit wide open, hang on, and own it." —Camp
|
|
Actually, that map you posted is helpful. If you do some comparisons with county maps in terms of positioning, that 141" data point is almost certainly Belleayre. It's due west of the Pepacton Reservoir and is in the extreme NW corner of Ulster county. That 161" data point is definitely in the vicinity of Plattekill, though that's harder to tell. When you look at the orientation of that higher band of annual snowfalls, it's on a NW to SE vector, which is consistent with the direction you'd expect if significant LES accumulations are influencing the numbers.
Basically, that bullseye of the greatest annual snowfalls is roughly in a Stamford to Andres to Lexington (junction of 42 and 23A) triangle, including Plattekill, Bearpen and possibly Bobcat on the southern edge. |
|
In reply to this post by Harvey
It looks like this snow map follows the Catskill snow averages that are listed in skiernet. The 165 is Plattekill, the 100 sw of Platte is Bobcat, Tin pointed out that the 141 is Belleayre, the 125 could be Hunter and the 110 could be Windham. Maybe the ski areas are the official observers for this snowfall map. Gore matches the 150 site and you could see were Haystack, Mt Snow, and Stratton might match up in VT. |
|
Administrator
|
This post was updated on .
I think you guys are right. Gore is at 150 inches which, I think, we all accept to be true. I believe Hickory checks in at the 98" listed and I believe West is on there at the 80" reported. All of those triangles seem associated with peaks, not valleys. The contentious issue would be Platte. The 165 is right about where I thought they were. I'd love to know what that measuring point is in North River at 125 inches. By location it could actually be Harvey Mountain. I'm surprised to see anything in North River, at elevation, coming in less than Gore. Whenever I measure snow depth at the cabin, it's usually pretty comparable to what Emily is posting on the Gore website. If there was a photoshop wizard our there who could put clear labels on this map ... it would be a great resource.
"You just need to go at that shit wide open, hang on, and own it." —Camp
|
As mentioned in the Bobcat thread, the reason I believe Platte's numbers to be higher than 165 is more anecdotal than scientific, but here it is: 1. Belleayre's average in the 150s is accepted to be accurate. 2. Over the years, every time I go to Plattekill (usually after a recent snowfall), it's ALWAYS at least 20% more than Belle. Everyone I know who skis in the Catskills (people who've been going there a lot longer than me) agrees with this conventional wisdom. I've even heard Tony Lanza at Belle say that. IMHO, there is simply no way that Platte only gets a foot more annual snowfall than Belle. |
|
Administrator
|
This post was updated on .
In reply to this post by x10003q
I did my drill on this once again this morning. Googling variations of ... "new york state average annual snowfall map." I actually tried a bunch of variations, and "Binged" the whole process as well. It's easy to find maps published by KBUF that cover the heart of lake effect zones:
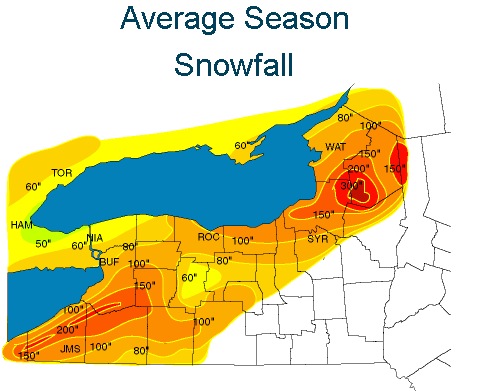 It's cool to see Tug Hill, but skiers are also very interested in the LE fringes in the Cats and Adks. This is a handy link, that is a little funky to use, but pretty cool. The link actually sits on the HR Blog home page, at the bottom left. It's New York State Snowfall Totals by Season. The page is a little funky to use - you see a blank page until you use the dropdown in the upper left. It has not been updated to include this past season. EDIT: Just found this... 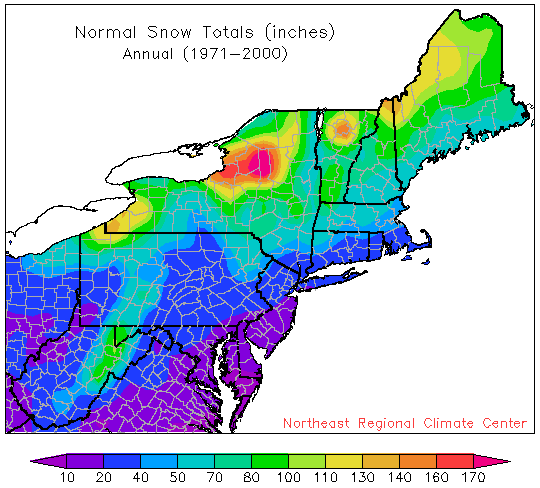 And here's the map that got James and I jawbonin' in the first place. It's represents this year's calendar winter, New York States Departure from Normal Precipitation in qpf (liquid). This is something I found that I'd never seen before. I'm sure its real. 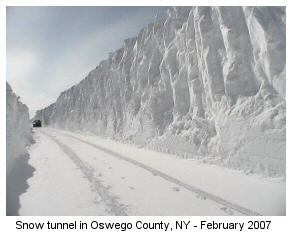
"You just need to go at that shit wide open, hang on, and own it." —Camp
|
|
This post was updated on .
I've routinely found that that what falls on the Tug can also be found in W adks Hamilton county about 15 miles west of rte 30. Seems to taper off the closer you get to 30. Not sure how accurate those noaa maps are for that area. Last year mid Jan I looked at those and they dipicted the snow depth of around 16". We easily found double that.
Here's a couple pics from last Jan were they showed 16" on the ground  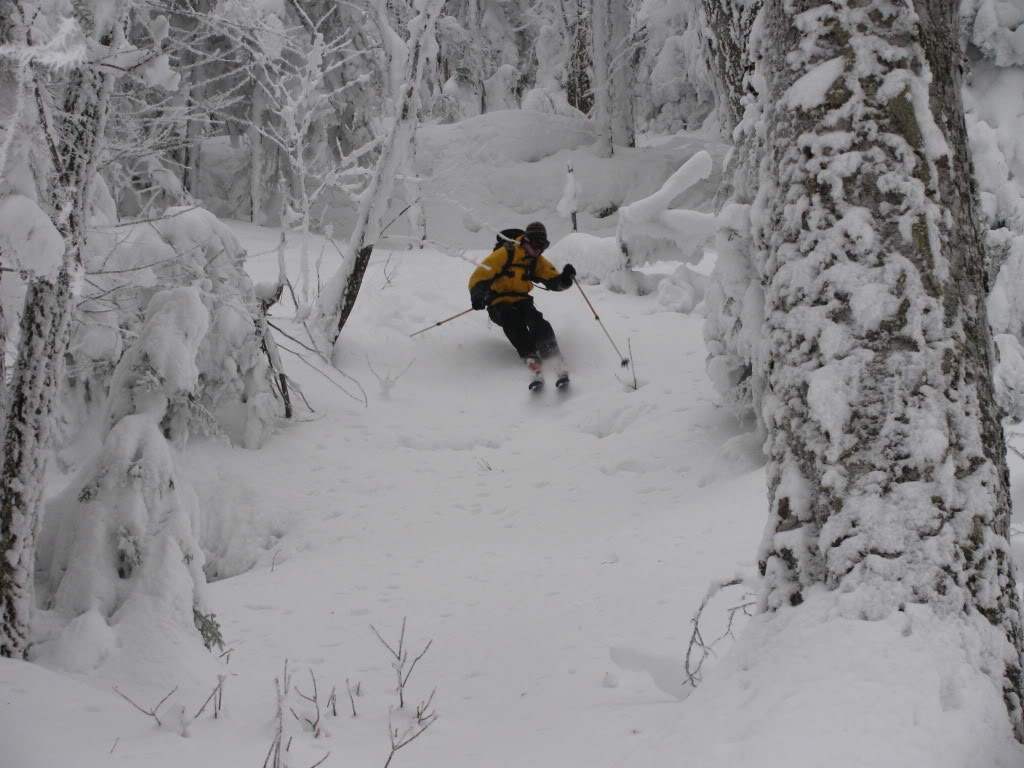
|
|
Here's LE pic from 2007. There were many episodes were someone was completely buried. Not as much as Oswego got, but I think it was something like "110.
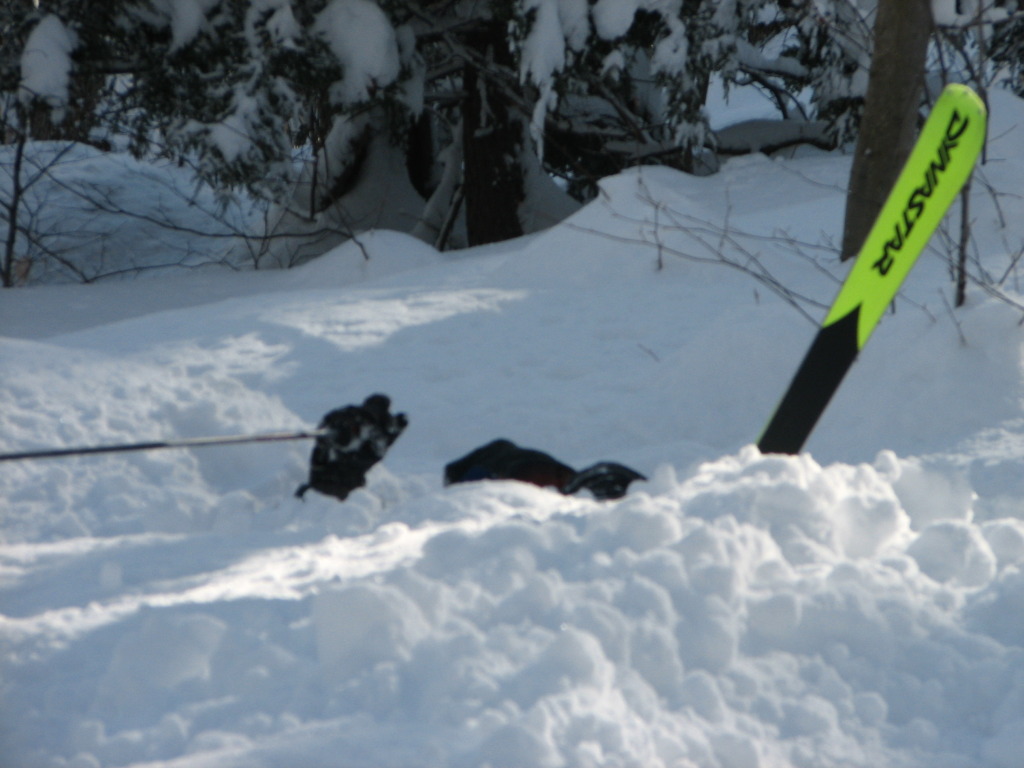
|
|
In reply to this post by skimore
Did you mean 15 miles WEST of Route 30?... |
|
yes.........west
|
|
Administrator
|
This post was updated on .
In reply to this post by skimore
No doubt that you have to know how to interpret maps for elevation and favored locations. If you follow things closely you get to know how to interpret what you're hearing for valley locations. If North Creek falls in an area labeled is 12+ inches that will be skiing in some very deep snow up on Gore.
I have little experience skiing LE, Hamilton County or the terrain west of Route 30. Would really like to change that. This photo is a classic. It reminds me of the time Jason had to save a girl at Plattekill who fell in deep because she was texting while skiing: Some of these photos make me believe that skimore should submit images for Friday's Fantasy Photos.
"You just need to go at that shit wide open, hang on, and own it." —Camp
|
|
Harv, This is a great thread. You did a great job with the maps and data..
I don't know if this was mentioned or not. Is most LES events occur early in the season, late Nov thru early Jan. By January the lakes usually have cooled and have lost their thermal potential..So when cold air flows across them there is no longer a steep lapse rate..
"Peace and Love"
|
|
In reply to this post by Harvey
First, let me say that the geek factor is really high here.
Also, the photo below is not in Oswego, NY. That was a hoax. This is something I found that I'd never seen before. An image from the aftermath of Valentine's Day 2007:  |
|
Administrator
|
I admit that posting about Lake Effect in mid-August is pure geekdom. With regard to the hoax, I already have a blog disclaimer. I may need a forum disclaimer to go with it: "I am just a guy with a computer googlin for ski porn. I make no claims about the voracity of my forum posts." In fact a primary raison d'etre for the forum is to allow me to escape the modicum of voracity required by the blog. 
"You just need to go at that shit wide open, hang on, and own it." —Camp
|
|
Administrator
|
This post was updated on .
In reply to this post by skimore
As skimore pointed out in the ski video thread...
Lake Effect rain is a good sign for the early season on the Tug: 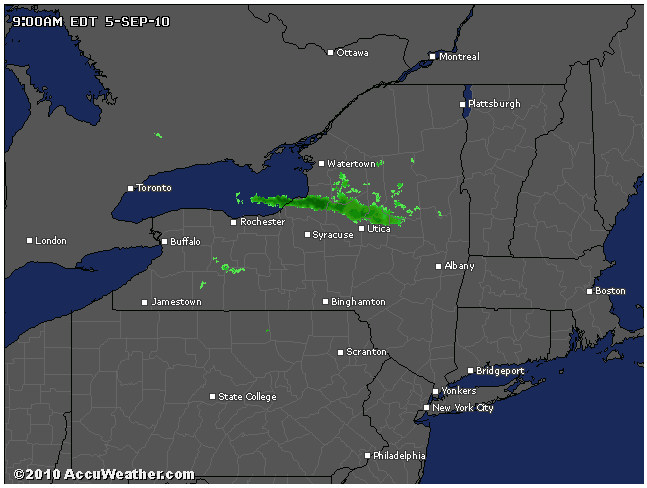 Also found this Cape Cod (and Catskills) Lake Effect in the vault: 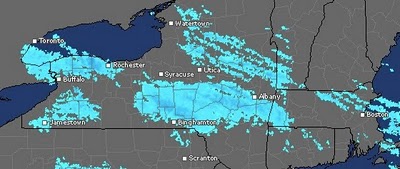
"You just need to go at that shit wide open, hang on, and own it." —Camp
|
|
cool shot..
on the cape it's called ocean effect..never amounts to much more than 2-3 inchs, due to the lack of any real orographic lift and a shorter fetch..
"Peace and Love"
|
«
Return to Weather Archive
|
1 view|%1 views


